Data filtering is basically used for getting a part of your data set. so that can get some particular result for insight. it is what I do every single project. It is also one of the important tasks when doing EDA. but is not difficult!.
So today, I want to talk about how I do and how to visualize with the filtered data.
np.where()
I wanted to start with this,
pie['Apple_pie'] = np.where(pie.pie1=='Apple pie', '1','0')it is just a sample. In order to know about how a big ratio the apple pie is, we call the value of Apple pie as 1 and others are 0.
so now you could make a pie chart and see the ratio with visualization.
from plotly.offline import init_notebook_mode, iplot
cnt_ = pie['Apple_pie'].value_counts()
fig = { "data": [{
            "values": cnt_.values,
            "labels": cnt_.index,
            "domain": {"x": [0, .5]},
            "name": "Train types",
            "hoverinfo":"label+percent+name",
            "hole": .7,
            "type": "pie"
        }],
        "layout": {
            "title":"Pie chart",
            "annotations": [{
            "font": { "size": 20},
        "showarrow": False,
        "text": "Pie Chart",
        "x": 0.50,
        "y": 1
        },
        ]
    }
}
iplot(fig)
So I normally use this function when I want to get the ratio of values and NaN values. it is useful!!.
I will not talk about visualization deeply in this post. So, let's move to the next!!
loc[]
I've got many situations that need to get a particular range of a column. for instance, you may want to get a particular period of time. You can then use this function. But today's example is focused on yummy pie data set.
pie.loc[(pie['price'] < 3000) & (pie['price'] >= 2000)]
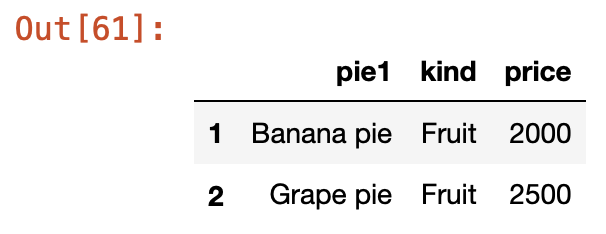
How easy is it!?. you can definitely go deeper. It depends on your needs.
sort_values()
This one is quite similar to right before, but this way is sort values and counts as well. Let's see.
pie[pie["name"]=="Peanut pie"].sort_values("place", ascending=False).groupby("place").count()
Let's say you want to eat a piece of peanut pies. and you are in Seoul. then, you could use the function above in order to find the places out and how many places in there.

You are lucky about being in Seoul!. There are four pie places. Do you like it?!
It is a deeper version. I set a particular place because I'm in Incheon now. haha
pie[(pie["name"]=="Peanut pie") &
          (pie["price"]<4000) &
          (pie["price"]>3000) &
          (pie["place"] == "Incheon")
         ].sort_values("place", ascending=False).dropna().groupby(["place"]).count()
It is another way. you could just get whatever you want with your taste.
pie["name"][(pie["name"] == 'Banana pie') & (pie["price"] == 2000)]
To select rows which have several words
pie.loc[pie['name'].apply(lambda x: len(x.split(' ')) == 2)]

Thank you for coming to my blog.
See you next time!
'Python skills for Data Analysis' 카테고리의 다른 글
| [Functions] apply(lambda x :) examples (0) | 2020.08.15 |
|---|---|
| [Functions] groupby examples (0) | 2020.08.14 |
| Data Visualization(데이터 시각화) (0) | 2020.07.14 |
| Missing value processing. (0) | 2020.06.27 |


